LikertMakeR: Generating Your Own Rating-Scale Data
1. Introduction: The “Missing Data” Anxiety
We’ve been there: you are reading a novel research paper, and the results are exactly what you need for a meta-analysis or a classroom example. You scroll to the bottom, hoping for a link to the raw data, only to find it is locked behind a “data available upon request” wall — which, as we know, is often academic code for “it’s buried in a hard drive I lost in 2014.”
Or perhaps you are an educator who needs a “clean” dataset for a live demonstration this week. I once spent most of a day trying to find a “real-world” dataset to demonstrate Exploratory Factor Analysis. Of course real data are never clean. Never again.
This is where “ethical faking” comes in. Synthetic data is not about “cheating” or fabricating results to deceive; it is a tool for understanding, transparency, and instruction.
Introducing the R package LikertMakeR. With LikertMakeR, we can synthesize Likert-scale and related rating-scale data that perfectly matches predefined statistical properties.
2. Reverse-Engineering
Often, researchers only report summary statistics — the means and standard deviations — leaving the actual distribution of responses a mystery. And this runs counter to every reputable text on data analysis: “Always look at the data”.
I’ve had a lot of practice, so it’s easy for me to read a reported mean and standard deviation and then visualise the distribution in my mind. That’s rarely the case for most of my colleagues, and certainly not for students.
This is where synthetic data steps in. Instead of staring at a mean
of, say, 3.42 and a sd of 1.15, you can use functions like
lfast() to generate a synthetic dataset of 500 observations
that matches those moments exactly. If you are looking to rescue data
from old paired t-tests or repeated-measures summaries, the package
provides specialized tools like makePaired() and
makeRepeated().
Once you’ve synthesized the data, you can move beyond bland summary tables and into the tidyverse, using ggplot2 to create density plots or patchwork to compare distributions.
3. Data on Demand: Teaching with real data is often fraught
If you have ever tried to demonstrate statistical analysis during a live lecture, you know that data and software have a wicked sense of humour — they rarely cooperate when students are watching. Synthetic data removes this volatility.
By generating data with known properties, you can guarantee that your lesson on reliability actually shows the reliability you intended to teach. It allows an instructor to demonstrate specific statistical phenomena with confidence, ensuring the focus remains on the pedagogical method rather than troubleshooting a noisy, uncooperative dataset.
4. The “Umm, Actually” Moment: Defining a Real Likert Scale
I need to be pedantic for a moment: Using the term “Likert Scale” to describe a single 1-5 rating question is the quickest way to make a psychometrician cry.
A true Likert scale is the mean, or sum, of several ordinal rating questions, or “items”. Such items are bipolar (usually “agree-disagree”) responses to various propositions that, together, capture one facet of a theoretical construct.
When Rensis Likert published his “A Technique for the Measurement of Attitudes” in 1932, he used the logic that, on average, a random overstatement on one item (question) is likely to be compensated by a random understatement on another item, so that, when aggregated, the final scale produces a consistent and reliable measure of the target construct.
The Math of Summated Scales: Summated rating scales are discrete and bounded. Their range is a direct function of the number of items and the scale points:
- A scale made of five items, each rated 1-5, produces a summed range of 5 to 25 (all integers). The mean range is 1.0 to 5.0 with intervals of 1/5=0.20.
- A scale made of eight items, each rated 1-7, produces a summed range of 8 to 56, or averaged to give a range is 1.0 to 7.0 with intervals of 1/8=0.125.
Those lower and upper boundaries produce an interesting distributional side-effect of rating scales. When a standard deviation is wide, or the mean is off-centre, then data crowd up against the boundary, making the data skewed. If we want to define parameters for generating synthetic data, it turns out that we don’t have to define third and fourth moments (skewness and kurtosis) - they are automatic outcomes of crowding against the boundaries.
5. Breaking the Lab: Simulation and Methodological Stress-Testing
For the methods-focused researcher, LikertMakeR functions as a high-tech “sandbox.” It allows you to explore the interaction between sample size, number of items, and reliability before you ever spend a dime on recruitment.
The package provides several “magic wands” for these simulations:
-
lfast(): Generates bounded/discrete data with a target mean and SD. -
lcor(): Rearranges columns to approximate a target correlation matrix. -
makeCorrAlpha(): A true lifesaver that generates an item correlation matrix from a target Cronbach’s alpha—solving one of the most frequent pain points in student simulations. -
makeScales(): A powerful wrapper that combines the above functions to generate a full dataframe of correlated columns.
6. Getting Started (Without the Headache)
Quick Start Example: Here is a 30-second “win” to get you started. We will create a Likert scale that “reproduces” and a scale from a published report, so we can visualise the data.
library(LikertMakeR)

set.seed(42)

# 1. Define scale parameters

sample_size <- 256
scale_mean <- 3.5
scale_sd <- 0.85
lower <- 1
upper <- 5
n_items <- 4

# 2. Generate the data

df <- data.frame(
  x = lfast(
    n = sample_size,
    mean = scale_mean,
    sd = scale_sd,
    lowerbound = lower,
    upperbound = upper,
    items = n_items
  )
)

# 3. Test the data

mean(df$x)
## [1] 3.500977
sd(df$x)## [1] 0.8493071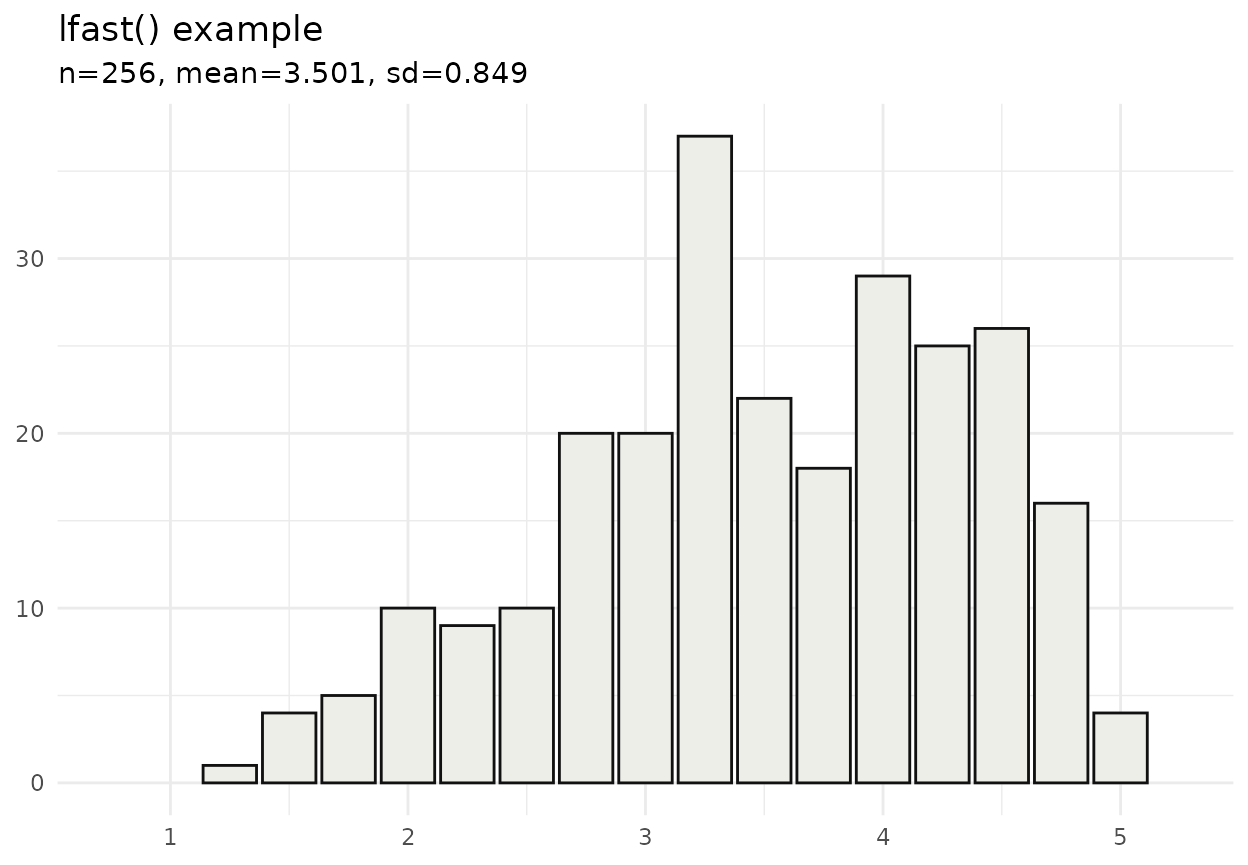
7. Conclusion: The Future is Synthetic
The ability to synthesize data is a vital skill for the modern researcher and educator. Whether you are aiming for better reproducibility by reverse-engineering published results, seeking the predictability of “known properties” for a classroom demo, or performing rigorous methodological “stress-tests,” LikertMakeR provides the necessary toolkit to do so ethically and accurately.
By embracing synthetic data, we move away from “missing data anxiety”
and toward a more empowered, experimental approach to statistics. In our
next session, we will dive deeper into the technical side of the
package, specifically exploring the makeScalesRegression()
function to generate data for multiple-regression analysis and complex
repeated-measures designs. Until then, go forth and make your own
data!