WinzarH.github.io
Easy access to some of my work for colleagues
Purpose
Recent conference papers and journal articles reference some innovative techniques, data analyses, and data visualisations. I created this repository to share the code for these projects.
Contents
LikertMaker
NOTE: superseded by the LikertMakeR package available on CRAN.
The Development version is accesible from this GitHub repository at https://github.com/WinzarH/LikertMakeR
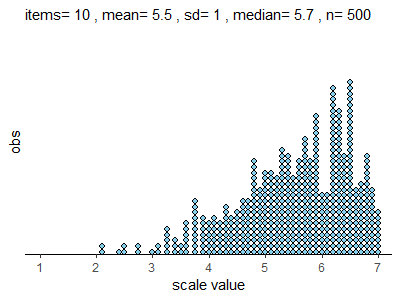 A novel method to reproduce Likert-scale data using only mean and standard deviation so that they can be properly visualised and interpreted
Application
Most simulations of Likert-scale data are created to test analysis methods before finalising a questionnaire. Here, however, we want to reproduce published results where only the first two moments (mean and variance) are reported. Many publications report only means and standard deviations of rating scales, often only the means. The boundaries of a scale (1-5, 1-7, etc.) will often produce skewed data, so such simple statistics can be misleading. We demonstrate the application of Differential Evolution Optimisation to synthesise Likert-scale data using only the first two moments (mean and standard deviation). The algorithm is surprisingly accurate at reproducing published data.
LikertMaker is a Shiny app embedded inside a single Quarto document for easy download and use.
Requirements
You will need to have installed:
- the R statistical programming language
- a recent version of RStudio GUI program
- the following packages should be installed automatically if not already installed
- dplyr (data manipulation)
- ggplot2 (data visualisation)
- shinybusy (calculation/ progress indicator)
- DEoptim (non-linear optimisation)
Correlator
Note: superseded.
Now in the LikertMakeR package
A program that rearranges data points in a vector so that two vectors have a predefined correlation.
Application
After creating two Likert-scale data sets using LikertMaker this program rearranges the values so that the two scales are correlated at a level defined by the user. I envision the program can be used to synthesise data that are only reported with means, standard deviations and correlations. This permits visualisation of the data
Correlator is offered as an R file. I intend to create an interactive Shiny app in the future. Maybe.